Business Intelligence · Real cases

Dashboards that turn data into decisions.

We build Power BI dashboards for finance, sales, logistics, quality and customer service. Solid data models, actionable KPIs and executive-grade visualization.

Talk to an advisor
Finance DashboardFinance · Accounting

Finance Dashboard

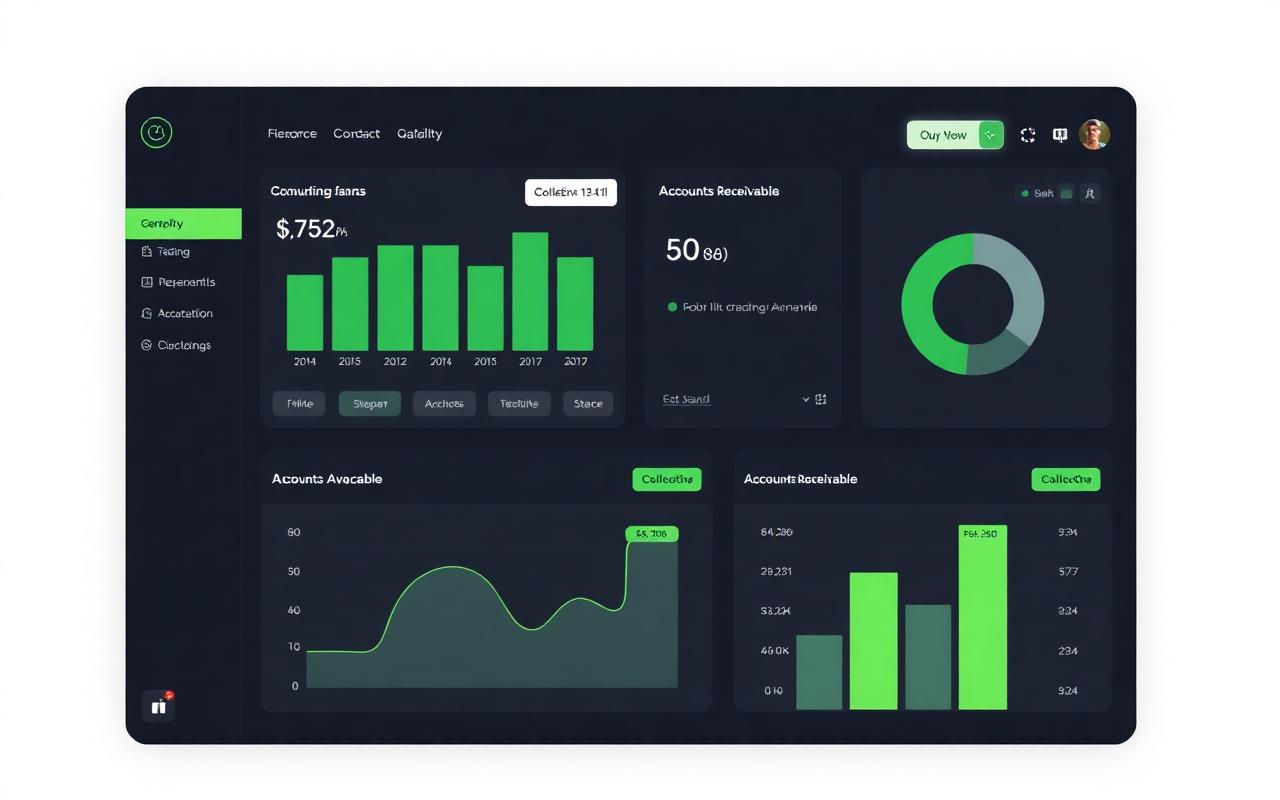
Consolidated P&L, accounting KPIs, collections and AR in a single dashboard. Daily visibility into the financial health of the business.

Key KPIs
  • Income Statement (P&L) by period and cost center
  • Gross margin, EBITDA and net income
  • Collections vs invoicing and DSO
  • AR aging by customer
  • Projected vs actual cash flow
Highlights
Automatic reconciliation with your accounting softwareDrill-down from the P&L down to the journal entryAlerts for overdue AR and budget deviations
Talk to an advisor
Sales DashboardCommercial · Revenue

Sales Dashboard

360° view of sales: by customer, sales rep, channel and product, with the KPIs that matter to the commercial team.

Key KPIs
  • Net sales by customer, rep, channel and product
  • Average ticket and purchase frequency
  • Quota attainment by rep and region
  • Product mix and per-SKU profitability
  • Pipeline, conversion rate and forecast
Highlights
Real-time top rep and customer rankingComparisons vs budget and vs prior yearRFM segmentation and at-risk customer detection
Talk to an advisor
Logistics DashboardOperations · Supply Chain

Logistics Dashboard

Inventory, deliveries and logistics processes under control. OTIF, turnover and operating cost indicators one click away.

Key KPIs
  • Inventory levels, days of cover and turnover
  • OTIF (On Time In Full) by customer and route
  • Delivery compliance vs schedule
  • Warehouse productivity (picking, packing, dispatch)
  • Logistics cost per order and per kilo moved
Highlights
Stock-out and overstock alertsDelivery map with geolocationLot → end-customer traceability
Talk to an advisor
Quality Sampling DashboardQuality · Manufacturing

Quality Sampling Dashboard

Statistical control of samples across quality, manufacturing and case-analysis processes. Decisions based on shop-floor data.

Key KPIs
  • % conformity and reject rate by line / product
  • SPC control charts and process capability (Cp, Cpk)
  • Non-conformities by root cause
  • Lab analysis times
  • Sample traceability and case analysis
Highlights
Direct connection to lab equipment and instrumentsAutomatic alerts on control-limit breachesHistory by batch, shift and operator
Talk to an advisor
Customer Service DashboardCX · Complaints

Customer Service Dashboard

End-to-end management of complaints, scheduled vs completed visits and customer experience measured with data, not perceptions.

Key KPIs
  • Complaints received, in progress and closed by type and channel
  • Average response and resolution time (SLA)
  • Scheduled vs completed visits by rep / region
  • NPS, CSAT and complaint recurrence
  • Root causes and responsible areas
Highlights
Per-agent dashboards with at-risk SLA alertsCross-analysis of complaints with sales and productAutomatic reports for regulatory bodies
Talk to an advisor
Limitless connectivity

We connect to any data source

Wherever your data lives — public cloud, on-prem servers or SaaS apps — we build the pipeline and model the data so your dashboard responds at the speed of business.

Cloud
Microsoft Azure, AWS, Google Cloud Platform.
Relational databases
SQL Server, PostgreSQL, MySQL, Oracle, MariaDB.
Data warehouses
Azure Synapse, BigQuery, Redshift, Snowflake.
ERPs & accounting
SAP, World Office, Siigo, Helisa, Dynamics, Odoo, and more.
CRMs
HubSpot, Salesforce, Zoho, Pipedrive and custom CRMs.
Files & APIs
Excel, CSV, Google Sheets, REST APIs, webhooks.

Ready to see your business in real time?

Book a demo and we'll show you real cases for your industry.

Contact us